Call Bob Moulton Today: (917) 627-0200 • Email: RobertMMoulton@gmail.com

This past week interest rates held steady to kick off the New Year. Let's discuss how the markets finished in 2024 and what to look for in the month of January.
"Here comes the sun, Here comes the sun, And I say, it's all right" Here Comes the Sun by The Beatles.
Lucky #7
2024 closed with home loan rates at 7%, much higher than many experts had predicted when the year began.
This spike in rates was a result of inflation remaining higher than expected and the Federal Reserve likely cutting rates less than expected in 2025. The good news, the story can change just like last year's forecast and result.
January Effect
January has historically produced high volatility and sharp swings in interest rates. The 10-year Note yield is a longer-term interest rate and generally moves alongside mortgage rates. Here are the interest rate moves for the 10-year Note year yield for each of the last three years.
- 2024 Jan 1st 3.86% to 4.19% Jan 24th
- 2023 Jan 1st 3.87% to 3.36% Jan 22nd
- 2022 Jan 1st 1.49% to 1.90% Jan 23rd
Note, these sizable interest rate moves took place in the first three weeks of the year.
Cross Currents for 2025
As we proceed through the weeks and months ahead, there are many cross currents, which will help or hurt home loan rates. Here's a list of just some of them below.
- Debt
- Deficit spending
- Oil
- Deregulation
- Inflation
- Tariffs
- Trade
- Business investment
- Manufacturing expansion or recession
- Consumer/business confidence
- Unemployment
- GDP
- Geopolitics
- Global economies
- Global central banks
- Fed
Of all the things that could help lower mortgage rates in 2025, the Fed may be the least likely. Current market expectations are for the Fed to cut rates just two times this year. Potentially having the largest impact on rates could be how our government addresses our current debt trajectory, which Fed Chair Powell has said is the "ultimate threat to the U.S. economy."
As it relates to fiscal policy, debt and deficit spending, we are still one month away from a new President, a new Congress and a new outlook on fiscal policy which will take time to get into place. This means uncertainty and volatility is likely to continue for the time being.
Bottom Line: No one knows what rates are going to do, but if history is any guide, we should prepare for a potentially sharp move in rates in January.
Looking Ahead
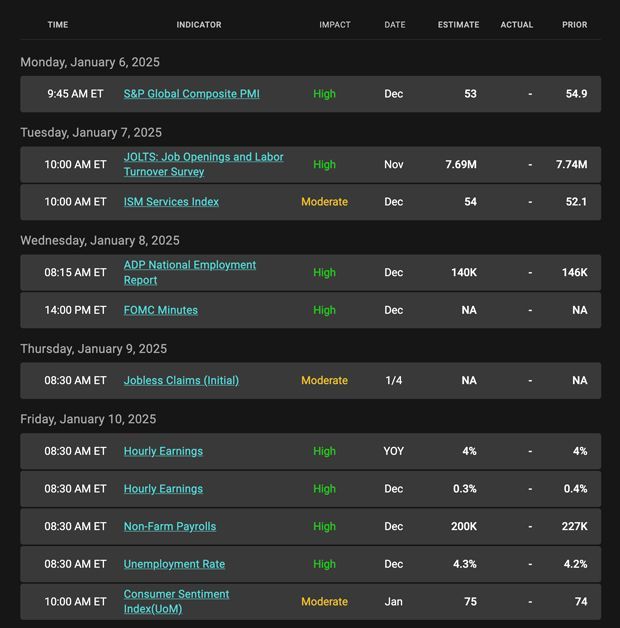
Next week, things get back to normal with the first full economic calendar for January. It's Jobs Week. We will see the December Jobs Report and how the labor market finished 2024. Another important reading will be the JOLTS report, which shows the level of hiring, quits and jobs available.
Next week also brings Treasury auctions and Fed speakers, which can have a big impact on market movements.
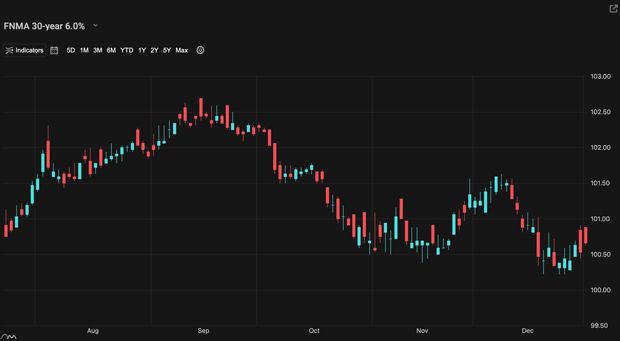
Mortgage Market Guide Candlestick Chart
Mortgage bond prices determine home loan rates. The chart below is a one-year view of the Fannie Mae 30-year 6.0% coupon, where currently closed loans are being packaged. As prices move higher, rates decline, and vice versa.
If you look at the right side of the chart, you can see how prices are trying to stabilize at the lowest levels since August.
Chart: Fannie Mae 30-Year 6.0% Coupon (Friday, January 3, 2025)
Economic Calendar for the Week of January 6 - 10


Registered Mortgage Broker-NYS Department of Financial Services
All mortgage loans arranged with third party providers.
NYS, CT, NJ, FL Department of Financial Services